The proposal calls for "community safety zones" around all schools in both cities, with speed limits reduced to 30 km/h and automated enforcement that would issue tickets for any speed over the limit. Before analyzing the potential traffic impact, I first examined whether this solution addressed an existing problem.
In a previous analysis, I looked at pedestrian accidents near schools in Kitchener over the past 7.5 years. The results? There weren't many. The few accidents that did occur were mainly concentrated around intersections at downtown schools and in Williamsburg. It seems we're solving a problem that doesn't actually exist.
If you knew there was a stretch of road where going even slightly over 30 km/h would get you a ticket, wouldn't you avoid it? The question is: where would you go instead?
I tried to find traffic analysis data to answer this question. Unfortunately, traffic studies are not comprehensive—they either involve someone literally counting cars by hand or using one of the city's limited number of counting machines.
A Different Approach
Since we can't get real traffic data, we can make educated guesses based on some reasonable assumptions:
1. People like to get where they're going quickly (shocking, I know)
2. Multiple lane roads are preferred (because nobody wants to wait behind someone turning left)
3. Roads with fewer traffic lights are better (for obvious reasons)
In essence, we figure out the time it takes to travel a given section of road and then penalize blocks with traffic lights and add a small speed bonus to roads with more than a single lane.
To overcome these data limitations, I applied network theory to model traffic patterns. By treating Kitchener-Waterloo's road network as a graph—with intersections as nodes and roads as edges—we can use betweenness centrality to predict likely traffic patterns.
Calculating betweenness simulates numerous trips between random points throughout the cities, identifying which roads are most frequently part of optimal routes. The resulting "betweenness" score provides a robust metric for predicting traffic patterns without requiring extensive physical measurements.
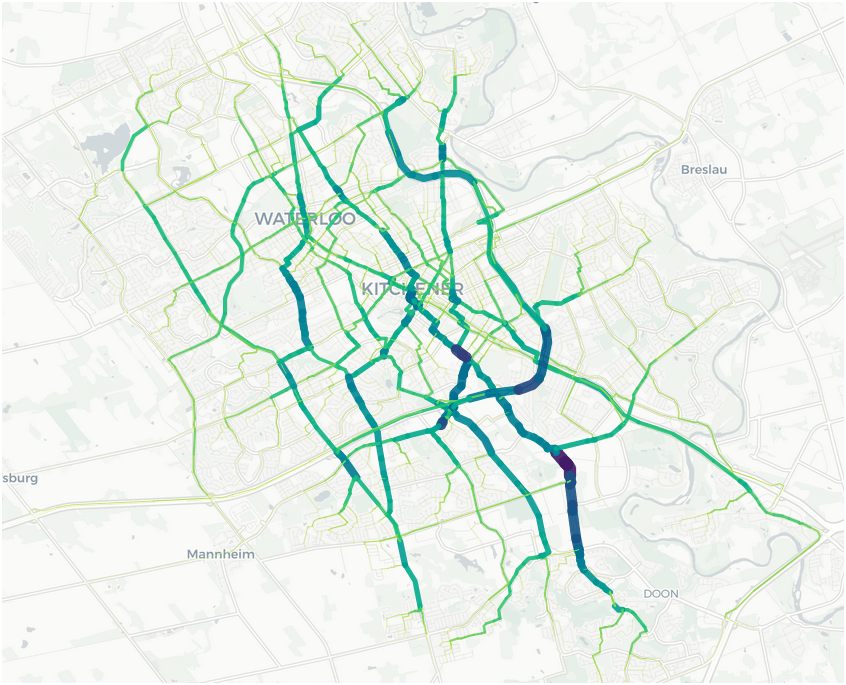
In the visualization below, thicker lines indicate roads that have a higher betweenness score.
The simulation gives each road a "betweenness" score from 0 to 100, showing how likely people are to use it to go between points on a random trip across the city. When mapped out, it actually matches reality pretty well:
* King Street, despite being our main artery, scores lower than you might expect (This is by design, the LRT has narrowed the roads to one lane and there are a lot of traffic lights.)
* Major arterial roads – like Weber Street – run on either side of King Street to carry cars.
* The highways (7 and 85) score high, as you'd expect.
The model's ability to reproduce these known patterns provided me with some confidence in its predictive capabilities.
Using open data from the government of Ontario, I calculated the betweenness value of all roads in Kitchener (Figure 1). To predict the impact of these new zones, I re-ran the simulation with 30 km/h speed limits within 100m of schools. I initially included major roads but quickly realized that would cause chaos. (I'm assuming our city councils aren't completely mad and won't put speed cameras on arterial roads.)
The results? We're likely to see quite a few local changes:
* Some areas may actually improve as drivers are pushed onto arterial roads instead of cutting through subdivisions
* Other areas, like around Resurrection Catholic Secondary School, might see more traffic on residential streets as drivers seek shortcuts
* Strange Street, which currently feeds into West Avenue and Queen Street, might see drivers finding creative alternatives through neighborhoods
The easiest way to see the difference is to subtract the betweenness measures in our base case from the slowed-down case where 30km/h safety zones are widespread. The results will show us which roads have become less optimal for drivers (i.e., have a lower betweenness score) than they previously were. We’ll also get to see newer routes that have become the new short-cuts across the road network of Kitchener-Waterloo.
The analysis revealed nuanced changes in different areas. For example, the Strange Street corridor, which currently serves as a connection between West Avenue and Queen Street, showed potential for significant changes in local traffic patterns. Similar effects appeared around Lancaster Street, suggesting that drivers might seek alternative routes through adjacent areas.
Some changes appear beneficial, potentially channeling traffic toward arterial roads. However, in other cases—such as the area around Resurrection Catholic Secondary School—the model suggests drivers might be incentivized to use residential streets to avoid speed-restricted zones. Similarly, reducing speed on Lancaster, another prominent road across the city, would encourage drivers to take other roads to avoid the safety zone.
In the visualization below, routes in red are routes that were formerly roads that were useful for many people taking trips in part of the city (i.e., had a high betweenness score.) After the speed reductions are put in place, the model predicts that the routes in blue will become more preferred for getting around in the area. The black points are public and Catholic schools and the orange lines on the road are (assumed) locations for potential traffic cameras.
The first time I ran this simulation, a series of major roads (for example, Weber Street, Margret Street, Highland Road and Westmount Road) became less favoured. However, it seems highly unlikely that councilors in either city would allow these arterial roads to be slowed down dramatically. So, despite their proximity to schools, I’ve assumed that these roads will not have 30km per hour zones placed in them. Otherwise, there would be dramatic changes to driving patterns in the city.
Instead, I am assuming that more local roads will see speed changes. This whole process of assuming roads within 100m of a school will have a camera is imperfect because, at least to my knowledge, we don’t have an authoritative list of camera locations yet.
Assuming that the region does not plan to put drastic speed limits on major roads, a pattern that emerges shows a series of local changes. For example, Strange Street runs through a city neighbourhood that leads to West Avenue, a road that leads around the city park to Queen Street, leading to a faster arterial road around the city. The new speed limits will encourage people to take other neighbourhood roads to avoid the slow area.
You can explore the results in Figure 2. This map highlights the differences between our current traffic system with no community safety zones and one where the zones are implemented. Red coloured roads are previously popular routes that will change. The blue routes indicate roads that according to our assumptions should be taken to reduce trip times between points. The thicker the line indicates a higher betweenness score.
While the previous analysis deliberately excluded arterial roads from speed limit modifications, recent information suggests the Region of Waterloo is considering reducing speed limits to 40 km/h on major roadways near schools. Though the exact implementation remains uncertain, a supplementary simulation can provide valuable insights into potential systemic changes.
We can see many differences from the previous map after considering speed reductions on major arterial roads. While the same changes in shorter road preferences are still present, there are also longer stretches of arterial roads that have become more or less preferred routes.
In the east, Weber Street and Margaret Street are highlighted in red, indicating that these roads will likely become less traveled. For example, Margaret Street has four schools along its length, which would slow down travel. It also seems that nearby residential streets would be more likely to become local “short-cuts” as these arterial roads become less effective for drivers.
On the opposite side of King Street, the betweenness of Westmount Road has decreased, presumably due to the schools on the road. It seems that traffic would increase parallel to that on Fischer-Hallman.
The reader should remember that these visualizations are meant to show how the network of optimal travel routes will likely change based on the betweenness network algorithm. Many of the most efficient routes through the city will remain unchanged even with the inclusion of school safety zones. It is also important to note that the visualization does not quantify the number of vehicles that may change routes. Instead, this exercise in data visualization is a crucial step to better understand some potential scenarios that could occur. One would hope that the Region has invested the time and effort to determine the likely systemic effects of major road changes.
My impression of the visualization is that the changes affecting speed limits around schools are likely to affect how people drive around their local neighborhoods. In some cases, these changes seem likely to encourage drivers onto arterial roads (i.e., probably a good thing). But in other cases, it seems to encourage through traffic into residential neighborhoods.
The changes become more confusing when we consider slowing down traffic for community safety zones along residential neighborhoods. Some streets, like Margaret Avenue, seem likely to be abandoned in favor of residential “short-cuts.” Other routes, like Westmount Road, also seem likely to encourage people to shift onto roadways even further out of the twin cities.
At a certain point, many small changes can have a large, unanticipated effect on the entire system. In this case, introducing many areas in the city road network where cars have to slow down, or drivers risk a steep fine is likely to inadvertently encourage drivers to find more optimal routes – even if those routes are actually along residential streets. The advent of Google Maps and similar mobile phone-based GPS systems means that all drivers could cut through residential neighborhoods to shorten their trip times. In fact, GPS systems guarantee that drivers are more likely to be systematically encouraged to drive on alternate routes away from planned arterial roads simply because these roadways are no longer efficient.
While these simulations aren't perfect, they give us a reasonable picture of how traffic patterns might change. In some places, the safety zones might actually be beneficial for residents, pushing traffic onto major roads. In others, they might just create new runs through residential areas.
Of course, it would be nice if Kitchener and Waterloo would share their own traffic studies justifying these changes. But until then, we'll have to make do with educated guesses and network theory—and perhaps a healthy dose of skepticism about solving problems that don't exist.